Workforce Data
Population of Christian County
33344
Median Age
20
Labor Force
14275
High School Degree or Higher
89.72
%
Data From Intersect Illinois
Approximately a 30 Mile Radius from Christian County
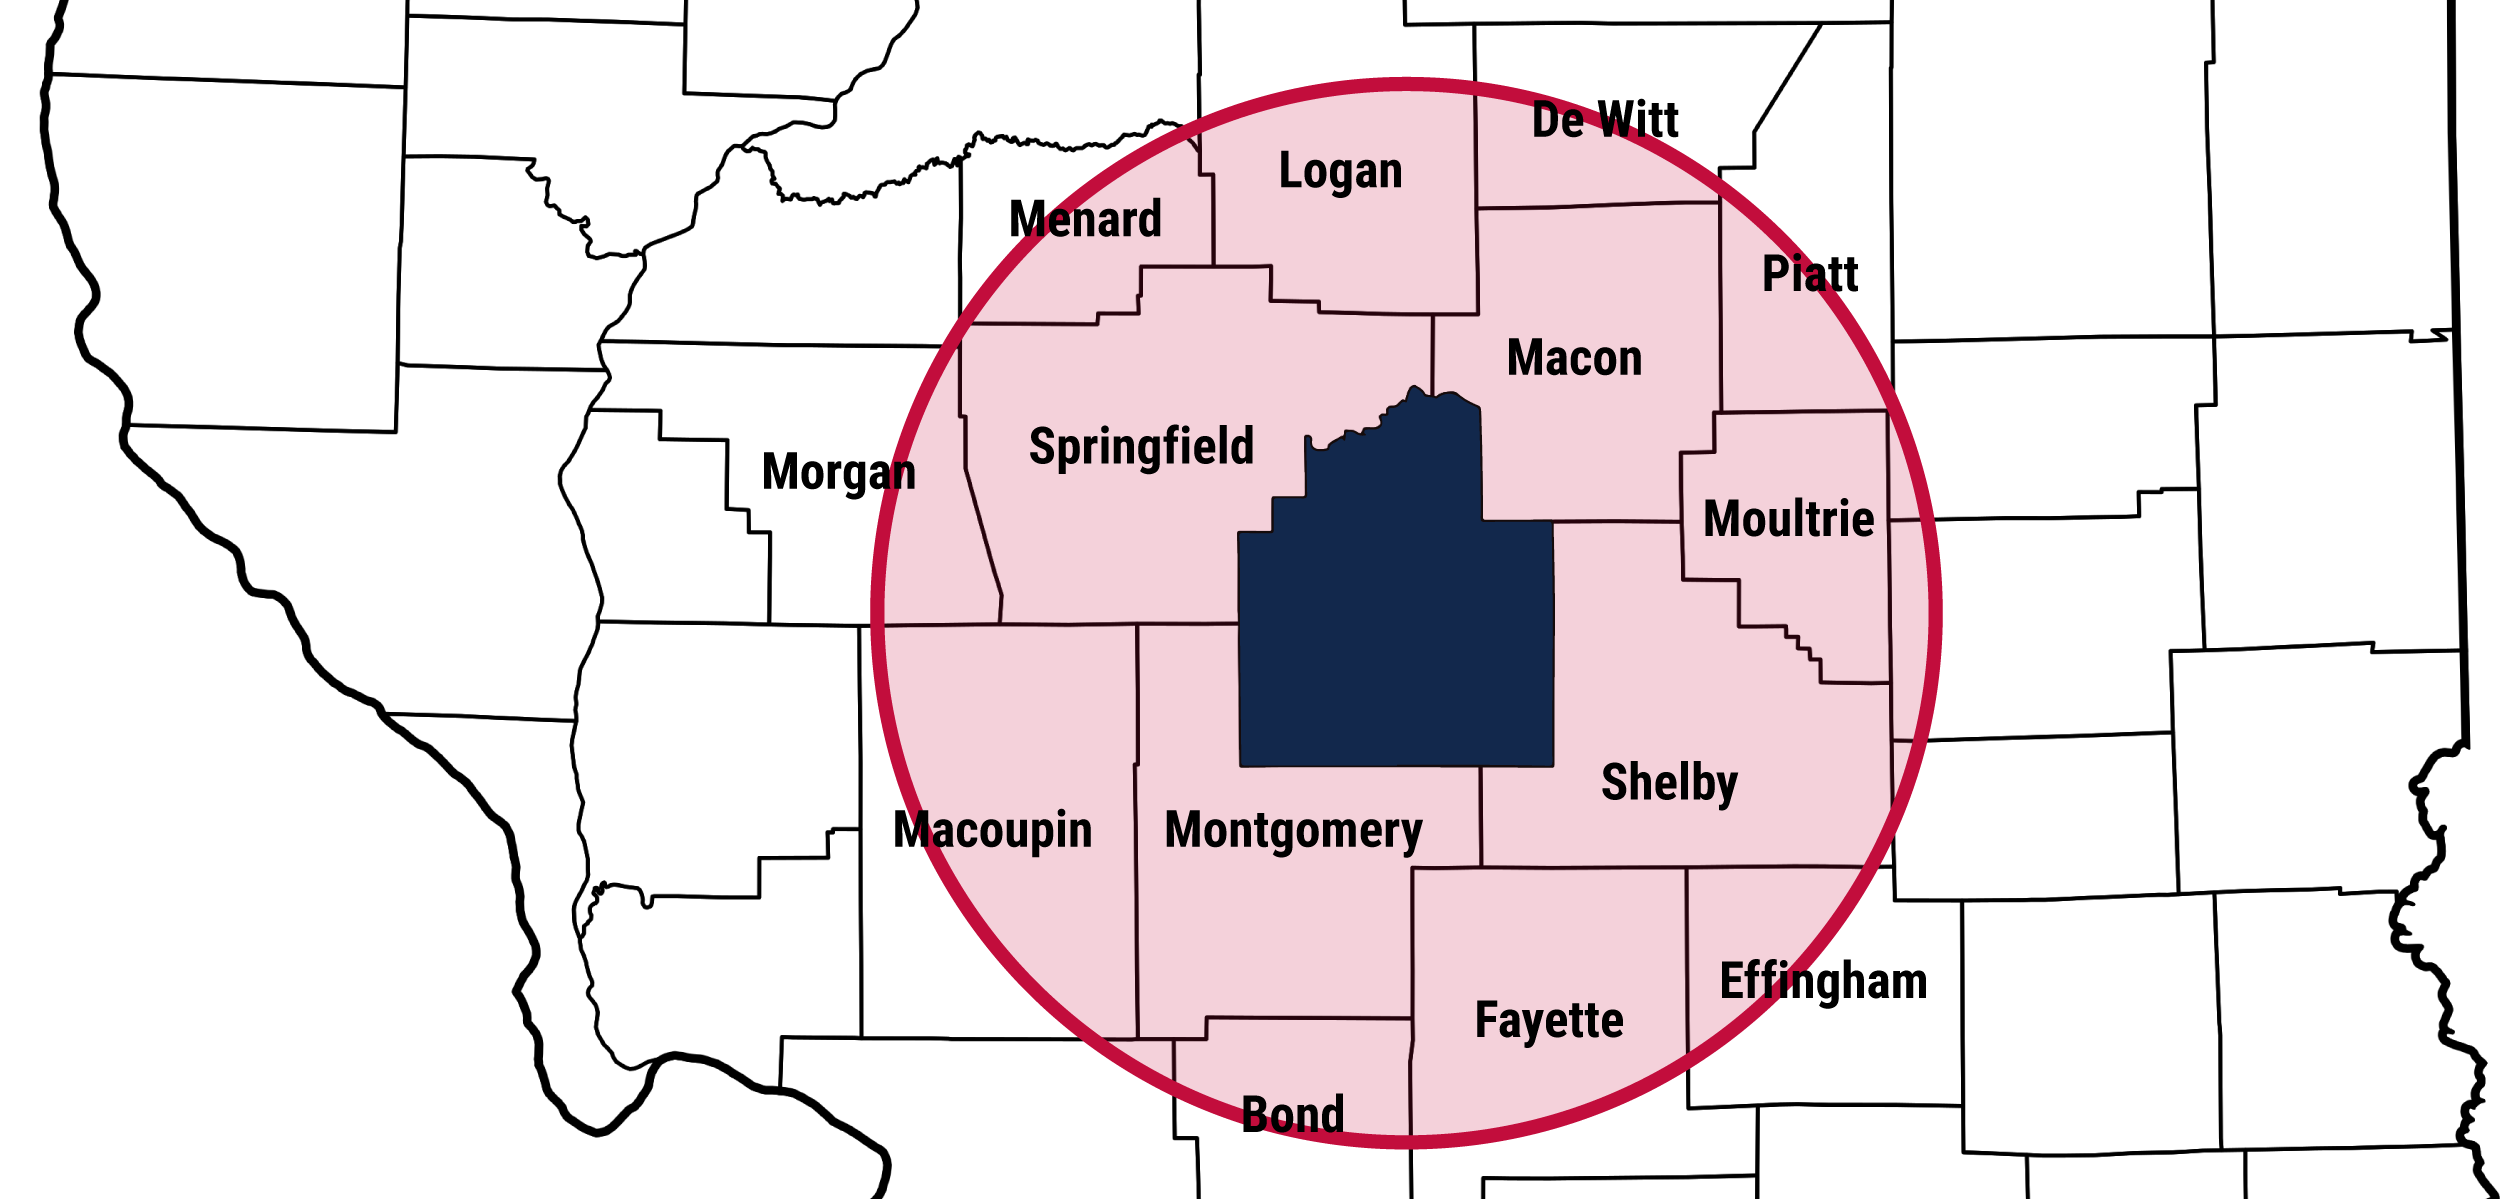
Christian County Workforce
30-Mile Radius Workforce
Source: U.S. Census Bureau, OnTheMap Application, https://onthemap.ces.census.gov
| ALL JOBS | COUNT | SHARE |
|---|---|---|
| Total All Jobs | 9,630 | 100.00% |
| JOBS BY WORKER AGE | COUNT | SHARE |
| Age 29 or younger | 2,159 | 22.40% |
| Age 30 to 54 1 | 4,797 | 49.80% |
| Age 55 or older | 2,674 | 27.80% |
| JOBS BY EARNINGS | COUNT | SHARE |
| $1,250 per month or less | 2,232 | 23.20% |
| $1,251 to $3,333 per month | 3,085 | 32.00% |
| More than $3,333 per month | 4,313 | 44.80% |
| JOBS BY NAICS INDUSTRY SECTOR | COUNT | SHARE |
| Agriculture, Forestry, Fishing and Hunting | 125 | 1.30% |
| Mining, Quarrying, and Oil and Gas Extraction | 20 | 0.20% |
| Utilities | 182 | 1.90% |
| Construction | 386 | 4.00% |
| Manufacturing | 1,352 | 14.00% |
| Wholesale Trade | 683 | 7.10% |
| Retail Trade | 1,246 | 12.9+C28% |
| Transportation and Warehousing | 147 | 1.50% |
| Information | 85 | 0.90% |
| Finance and Insurance | 350 | 3.60% |
| Real Estate and Rental and Leasing | 100 | 1.00% |
| Professional, Scientific, and Technical Services | 231 | 2.40% |
| Management of Companies and Enterprises | 0 | 0.00% |
| Administration & Support, Waste Management and Remediation | 268 | 2.80% |
| Real Estate and Rental and Leasing | 898 | 9.30% |
| Health Care and Social Assistance | 1,765 | 18.30% |
| Arts, Entertainment, and Recreation | 64 | 0.70% |
| Accommodation and Food Services | 795 | 8.30% |
| Other Services (excluding Public Administration) | 258 | 2.70% |
| Public Administration | 675 | 7.00% |
| JOBS BY WORKER RACE | COUNT | SHARE |
| White Alone | 9,196 | 95.50% |
| Black or African American Alone | 237 | 2.50% |
| American Indian or Alaska Native Alone | 13 | 0.10% |
| Asian Alone | 108 | 1.10% |
| Native Hawaiian or Other Pacific Islander Alone | 2 | 0.00% |
| Two or More Race Groups | 74 | 0.80% |
| JOBS BY WORKER ETHNICITY | COUNT | SHARE |
| Not Hispanic or Latino | 9,479 | 98.40% |
| Hispanic or Latino | 151 | 1.60% |
| JOBS BY WORKER EDUCATIONAL ATTAINMENT | COUNT | SHARE |
| Less than high school | 682 | 7.10% |
| High school or equivalent, no college | 2,559 | 26.60% |
| Some college or Associate degree | 2,584 | 26.80% |
| Bachelor's degree or advanced degree | 1,646 | 17.10% |
| Educational attainment not available (workers aged 29 or younger) | 2,159 | 22.40% |
| JOBS BY WORKER SEX | COUNT | SHARE |
| Male | 4,921 | 51.10% |
| Female | 4,709 | 48.90% |
Source: U.S. Census Bureau, OnTheMap Application, https://onthemap.ces.census.gov
| ALL JOBS | COUNT | SHARE |
|---|---|---|
| Total All Jobs | 236,645 | 100.00% |
| JOBS BY WORKER AGE | COUNT | SHARE |
| Age 29 or younger | 47,564 | 20.10% |
| Age 30 to 54 1 | 27,393 | 53.80% |
| Age 55 or older | 61,688 | 26.10% |
| JOBS BY EARNINGS | COUNT | SHARE |
| $1,250 per month or less | 43,416 | 18.30% |
| $1,251 to $3,333 per month | 68,028 | 28.70% |
| More than $3,333 per month | 125,201 | 52.90% |
| JOBS BY NAICS INDUSTRY SECTOR | COUNT | SHARE |
| Agriculture, Forestry, Fishing and Hunting | 1,482 | 0.60% |
| Mining, Quarrying, and Oil and Gas Extraction | 500 | 0.20% |
| Utilities | 2,309 | 1.00% |
| Construction | 9,826 | 4.20% |
| Manufacturing | 22,369 | 9.50% |
| Wholesale Trade | 8,295 | 3.50% |
| Retail Trade | 23,993 | 10.10% |
| Transportation and Warehousing | 5,615 | 2.40% |
| Information | 4,123 | 1.70% |
| Finance and Insurance | 8,980 | 3.80% |
| Real Estate and Rental and Leasing | 1,822 | 0.80% |
| Professional, Scientific, and Technical Services | 7,879 | 3.30% |
| Management of Companies and Enterprises | 1,356 | 0.60% |
| Administration & Support, Waste Management and Remediation | 9,063 | 3.80% |
| Real Estate and Rental and Leasing | 18,851 | 8.00% |
| Health Care and Social Assistance | 35,680 | 15.10% |
| Arts, Entertainment, and Recreation | 2,124 | 0.90% |
| Accommodation and Food Services | 16,588 | 7.00% |
| Other Services (excluding Public Administration) | 8,044 | 3.40% |
| Public Administration | 47,746 | 20.20% |
| JOBS BY WORKER RACE | COUNT | SHARE |
| White Alone | 206,000 | 87.10% |
| Black or African American Alone | 22,362 | 9.40% |
| American Indian or Alaska Native Alone | 520 | 0.20% |
| Asian Alone | 4,526 | 1.90% |
| Native Hawaiian or Other Pacific Islander Alone | 83 | 0.00% |
| Two or More Race Groups | 3,154 | 1.30% |
| JOBS BY WORKER ETHNICITY | COUNT | SHARE |
| Not Hispanic or Latino | 228,439 | 96.50% |
| Hispanic or Latino | 8,206 | 3.50% |
| JOBS BY WORKER EDUCATIONAL ATTAINMENT | COUNT | SHARE |
| Less than high school | 18,908 | 8.00% |
| High school or equivalent, no college | 56,681 | 24.00% |
| Some college or Associate degree | 63,865 | 27.00% |
| Bachelor's degree or advanced degree | 49,627 | 21.00% |
| Educational attainment not available (workers aged 29 or younger) | 47,564 | 20.10% |
| JOBS BY WORKER SEX | COUNT | SHARE |
| Male | 116,094 | 49.10% |
| Female | 120,551 | 50.90% |